Excel Trace Format: Difference between revisions
No edit summary |
|||
| (3 intermediate revisions by the same user not shown) | |||
| Line 1: | Line 1: | ||
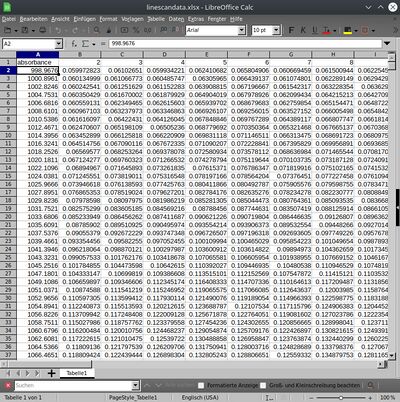
[[File:excel-format.jpg|400px|thumb|Screenshot of the Excel spreadsheet ''linescandata.xlsx'']] | |||
With version 1.04 of the ''mat2dcorr'' toolbox, spectra data from MS Excel spreadsheets can now be loaded in addition to hyperspectral imaging data in the CytoSpec data format and Matlab trace files. MS Excel spreadsheets should contain spectra series in a 2D data format, with the spectra as columns and the wavenumber vectors as rows. It is also important that the first row contains the vector with the data entries of the perturbing variable (temperature, pressure, etc.). The first column should contain the y-vector (wavenumber, frequencies, Raman shift vector) starting from row no. 2. <br> | |||
To load MS Excel trace files select Load Data → Excel data format → x-data, or y-data from the Load Data menu bar. <br> <br> | To use your own data with the MS Excel import function, it is recommended to analyze the structure of the example file ''linescandata.xlsx'' and replace the spectral data contained therein with your own data.<br> | ||
To load MS Excel trace files select ''Load Data'' → ''Excel data format'' → ''x-data'', or ''y-data'' from the ''Load Data'' menu bar. <br> <br> | |||
== Download test file == | == Download test file == | ||
Latest revision as of 15:02, 9 April 2025
With version 1.04 of the mat2dcorr toolbox, spectra data from MS Excel spreadsheets can now be loaded in addition to hyperspectral imaging data in the CytoSpec data format and Matlab trace files. MS Excel spreadsheets should contain spectra series in a 2D data format, with the spectra as columns and the wavenumber vectors as rows. It is also important that the first row contains the vector with the data entries of the perturbing variable (temperature, pressure, etc.). The first column should contain the y-vector (wavenumber, frequencies, Raman shift vector) starting from row no. 2.
To use your own data with the MS Excel import function, it is recommended to analyze the structure of the example file linescandata.xlsx and replace the spectral data contained therein with your own data.
To load MS Excel trace files select Load Data → Excel data format → x-data, or y-data from the Load Data menu bar.
Download test file
Download MS Excel test file linescandata.xlsx: https://wiki2dcos.microbe-ms.com/linescandata.xlsx
