Options of the 2D-COS Main Figure: Difference between revisions
Jump to navigation
Jump to search
No edit summary |
|||
| (5 intermediate revisions by the same user not shown) | |||
| Line 6: | Line 6: | ||
== Menu bar options == | == Menu bar options == | ||
File | '''File''' | ||
: '''save 2D spectrum''' - stores the 2D spectrum and corresponding metadata, for details see section [[Format_of_a_2D-COS_Result_File|Format of a 2D-COS result file (Matlab)]] | : '''''save 2D spectrum''''' - stores the 2D spectrum and corresponding metadata, for details see section [[Format_of_a_2D-COS_Result_File|Format of a 2D-COS result file (Matlab)]] | ||
: '''clear''' - data are deleted from memory and figures are set back to their initial state | : '''''clear''''' - data are deleted from memory and figures are set back to their initial state | ||
: ''' | : '''''quit''''' - exit the program | ||
'''Load data''' | |||
: '''''Matlab imaging forma'''''t: see [[Matlab_Imaging_Format|Import data in the imaging format (Matlab)]] | |||
: '''''Matlab trace format''''': see [[Matlab_Trace_Format|Import data in the trace format (Matlab)]] | |||
: '''''Excel data format''''': see [[Excel_Trace_Format|Import data in the MS Excel data format]] | |||
'''Action''' | |||
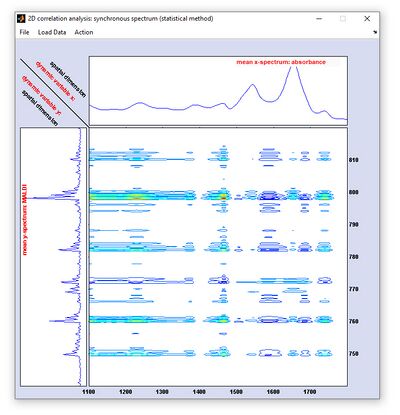
: '''''plot 2D spectrum''''': computes the 2D correlation spectrum using the actual settings of the [[Options_of_the_2D-COS_Control_Window| 2D-COS control window]] | |||
: '''''extrema of 2D fcn (function)''''': obtains the minimum and maximum intensities of the current 2D correlation spectrum | |||
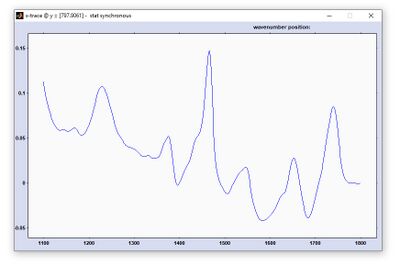
: '''''plot x-slice''''': plots a 1D correlation (x) slices at a fixed y-position using the setting from the edit field ''[x,y] slice coordinates'' (y) of the [[Options_of_the_2D-COS_Control_Window| 2D-COS control window]], see screenshot to the right | |||
: '''''plot y-slice''''': plots a 1D correlation (y) slices at a fixed x-position using the setting from the edit field ''[x,y] slice coordinates'' (x) of the [[Options_of_the_2D-COS_Control_Window| 2D-COS control window]], see screenshot to the right | |||
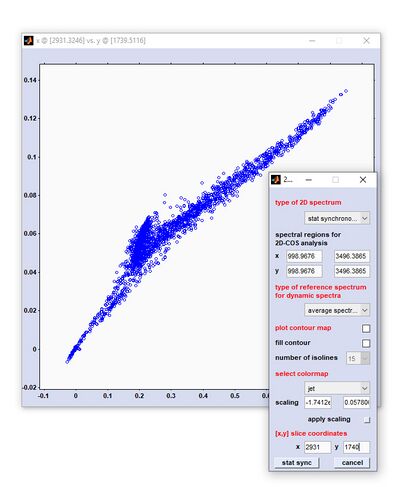
: '''''plot [x,y] spectral features''''': creates an [x,y] feature plot using the settings from the edit fields ''[x,y] slice coordinates'' of the [[Options_of_the_2D-COS_Control_Window| 2D-COS control window]], see screenshot to the right | |||
: '''''invert colormap''''': inverts the colormap | |||
: '''''save 2D function''''': the current color representation of the 2D correlation spectrum can be stored in one of the following image formats: bmp, tif, png, and jpg | |||
: '''''save gui to file''''': the current main user interface, including the 2D correlation function and the x- and y-mean spectra, are allowed to store in one of the following formats: pdf, eps, (vector graphic formats) tif, png, jpg, (image formats) and send to clipboard (no data are stored) | |||
: '''''display 2D-COS intensity (on/off)''''': chose ''on'' to enables the ''MouseOver'' functionality; the option is helpful to obtain the intensity of the 2D correlation spectrum at defined [x,y] positions <br> <br> | |||
== Context Menu == | == Context Menu == | ||
: '''plot x-slice''': plots a 1D correlation (x) slices at a fixed y-position using the setting from the edit field ''[x,y] slice coordinates'' (y) of the [[Options_of_the_2D-COS_Control_Window| 2D-COS control window]], see screenshot below | : '''''plot x-slice''''': plots a 1D correlation (x) slices at a fixed y-position using the setting from the edit field ''[x,y] slice coordinates'' (y) of the [[Options_of_the_2D-COS_Control_Window| 2D-COS control window]], see screenshot below | ||
: '''plot y-slice''': plots a 1D correlation (y) slices at a fixed x-position using the setting from the edit field ''[x,y] slice coordinates'' (x) of the [[Options_of_the_2D-COS_Control_Window| 2D-COS control window]], see screenshot below | : '''''plot y-slice''''': plots a 1D correlation (y) slices at a fixed x-position using the setting from the edit field ''[x,y] slice coordinates'' (x) of the [[Options_of_the_2D-COS_Control_Window| 2D-COS control window]], see screenshot below | ||
: '''plot [x,y] spectral features''': creates an [x,y] feature plot using the settings from the edit fields ''[x,y] slice coordinates'' of the [[Options_of_the_2D-COS_Control_Window| 2D-COS control window]], see screenshot below | : '''''plot [x,y] spectral features''''': creates an [x,y] feature plot using the settings from the edit fields ''[x,y] slice coordinates'' of the [[Options_of_the_2D-COS_Control_Window| 2D-COS control window]], see screenshot below | ||
Latest revision as of 09:09, 10 April 2025
Menu bar options
File
- save 2D spectrum - stores the 2D spectrum and corresponding metadata, for details see section Format of a 2D-COS result file (Matlab)
- clear - data are deleted from memory and figures are set back to their initial state
- quit - exit the program
Load data
- Matlab imaging format: see Import data in the imaging format (Matlab)
- Matlab trace format: see Import data in the trace format (Matlab)
- Excel data format: see Import data in the MS Excel data format
Action
- plot 2D spectrum: computes the 2D correlation spectrum using the actual settings of the 2D-COS control window
- extrema of 2D fcn (function): obtains the minimum and maximum intensities of the current 2D correlation spectrum
- plot x-slice: plots a 1D correlation (x) slices at a fixed y-position using the setting from the edit field [x,y] slice coordinates (y) of the 2D-COS control window, see screenshot to the right
- plot y-slice: plots a 1D correlation (y) slices at a fixed x-position using the setting from the edit field [x,y] slice coordinates (x) of the 2D-COS control window, see screenshot to the right
- plot [x,y] spectral features: creates an [x,y] feature plot using the settings from the edit fields [x,y] slice coordinates of the 2D-COS control window, see screenshot to the right
- invert colormap: inverts the colormap
- save 2D function: the current color representation of the 2D correlation spectrum can be stored in one of the following image formats: bmp, tif, png, and jpg
- save gui to file: the current main user interface, including the 2D correlation function and the x- and y-mean spectra, are allowed to store in one of the following formats: pdf, eps, (vector graphic formats) tif, png, jpg, (image formats) and send to clipboard (no data are stored)
- display 2D-COS intensity (on/off): chose on to enables the MouseOver functionality; the option is helpful to obtain the intensity of the 2D correlation spectrum at defined [x,y] positions
Context Menu
- plot x-slice: plots a 1D correlation (x) slices at a fixed y-position using the setting from the edit field [x,y] slice coordinates (y) of the 2D-COS control window, see screenshot below
- plot y-slice: plots a 1D correlation (y) slices at a fixed x-position using the setting from the edit field [x,y] slice coordinates (x) of the 2D-COS control window, see screenshot below
- plot [x,y] spectral features: creates an [x,y] feature plot using the settings from the edit fields [x,y] slice coordinates of the 2D-COS control window, see screenshot below


