Mat2dcorr - A Matlab Toolbox for 2D-COS: Difference between revisions
mNo edit summary |
No edit summary |
||
| (6 intermediate revisions by the same user not shown) | |||
| Line 1: | Line 1: | ||
__FORCETOC__ | __FORCETOC__ | ||
mat2dcorr - a free toolbox for performing two- | mat2dcorr - a free toolbox for performing two-dimensional correlation (2D-COS) analysis with [https://www.mathworks.com Matlab].<br> | ||
== Introduction == | == Introduction == | ||
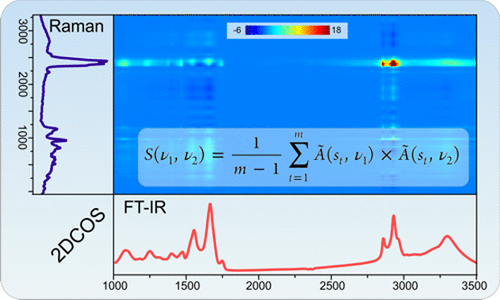
[[File: | [[File:GraphAbstr.gif|500px|thumb|Mat2dcorr: Illustration of heterospectral 2D-COS (FTIR vs. Raman)]] | ||
Since its introduction in 1989, two-dimensional correlation spectroscopy (2D-COS), sometimes referred to as two-dimensional correlation analysis, has become an invaluable analytical tool for spectroscopic characterization in various fields of application, including protein science, pharmacy, biomedical applications, and polymer or nanomaterial research. The technique of 2D-COS analysis was originally developed to study dynamic processes in which a spectroscopic probe is used to monitor the effect of an external perturbation on a given system. The system responds to the perturbation with characteristic changes that are monitored spectroscopically, e.g. by continuous acquisition of a spectral time series. The main purpose of 2D-COS investigations is to explore correlations that may exist between perturbation-induced spectral responses. In some situations, the 2D-COS analysis technique is useful not only to detect and visualize such correlations, but also to decipher the sequence of these spectral changes. Sources of perturbation may include changes in temperature, pH, pressure, concentration, or spatial coordinates when examining spatially heterogeneous samples. The 2D correlation concept has proven to be extremely useful in a wide variety of molecular spectroscopy applications based on IR, NIR, Raman, NMR, fluorescence and UV-visible spectroscopy. | |||
An introduction into the history, mathematics and basic principles of 2D-COS can be found here: https://en.wikipedia.org/wiki/Two-dimensional_correlation_analysis | An introduction into the history, mathematics and basic principles of 2D-COS can be found here: https://en.wikipedia.org/wiki/Two-dimensional_correlation_analysis | ||
| Line 34: | Line 33: | ||
== Related Publications and Web Links == | == Related Publications and Web Links == | ||
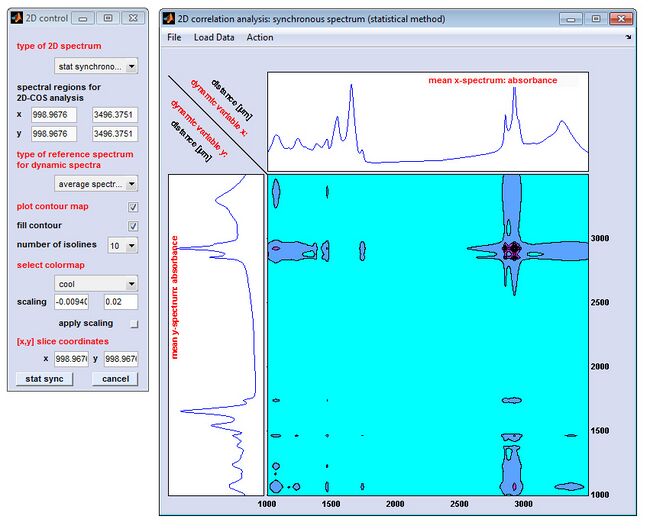
[[File: | [[File:2D-COS.jpg|650px|thumb|Mat2dcorr: Screenshot of the 2D control window (left) and the window ''2D correlation | ||
analysis ...'' (right)]] | |||
* [https://en.wikipedia.org/wiki/Two-dimensional_correlation_analysis Two-dimensional correlation analysis] (Wikipedia) | * [https://en.wikipedia.org/wiki/Two-dimensional_correlation_analysis Two-dimensional correlation analysis] (Wikipedia) | ||
* I. Noda. [https://doi.org/10.1366/0003702904087398 Two-Dimensional Infrared (2D IR) Spectroscopy: Theory and Applications], 1990 Appl. Spectrosc. 44(4): 550-561 | * I. Noda. [https://doi.org/10.1366/0003702904087398 Two-Dimensional Infrared (2D IR) Spectroscopy: Theory and Applications], '''1990''' ''Appl. Spectrosc''. 44(4): 550-561 | ||
* I. Noda. [https://doi.org/10.1366/0003702934067694 Generalized Two- Dimensional Correlation Method Applicable to Infrared, Raman, and other Types of Spectroscopy], 1993 Appl. Spectrosc. 47(9): 1329-1336 | * I. Noda. [https://doi.org/10.1366/0003702934067694 Generalized Two- Dimensional Correlation Method Applicable to Infrared, Raman, and other Types of Spectroscopy], '''1993''' ''Appl. Spectrosc''. 47(9): 1329-1336 | ||
* I. Noda. [https://doi.org/10.1366/0003702001950472 Determination of Two-Dimensional Correlation Spectra Using the Hilbert Transform], 2000 Appl. Spectrosc. 54(7): 994-999 | * I. Noda. [https://doi.org/10.1366/0003702001950472 Determination of Two-Dimensional Correlation Spectra Using the Hilbert Transform], '''2000''' ''Appl. Spectrosc''. 54(7): 994-999 | ||
* P. Lasch & I. Noda. [https://doi.org/10.1021/acs.analchem.7b00332 Two-Dimensional Correlation Spectroscopy for Multimodal Analysis of FT-IR, Raman, and MALDI-TOF MS Hyperspectral Images with Hamster Brain Tissue]. Anal. Chem. | * P. Lasch & I. Noda. [https://doi.org/10.1021/acs.analchem.7b00332 Two-Dimensional Correlation Spectroscopy for Multimodal Analysis of FT-IR, Raman, and MALDI-TOF MS Hyperspectral Images with Hamster Brain Tissue]. '''2017''' ''Anal. Chem''., 89, 9, 5008–5016 | ||
* P. Lasch & I. Noda. [https://doi.org/10.1177/0003702818819880 Two-Dimensional Correlation Spectroscopy (2D-COS) for Analysis of Spatially Resolved Vibrational Spectra]. 2019 Appl. Spectrosc. 73(4): 359-379 | * P. Lasch & I. Noda. [https://doi.org/10.1177/0003702818819880 Two-Dimensional Correlation Spectroscopy (2D-COS) for Analysis of Spatially Resolved Vibrational Spectra]. '''2019''' ''Appl. Spectrosc''. 73(4): 359-379 | ||
<br> <br> | <br> <br> | ||
Oct 02, 2023: more details of the mat2dcorr Matlab toolbox will follow soon | |||
Latest revision as of 15:35, 18 October 2023
mat2dcorr - a free toolbox for performing two-dimensional correlation (2D-COS) analysis with Matlab.
Introduction
Since its introduction in 1989, two-dimensional correlation spectroscopy (2D-COS), sometimes referred to as two-dimensional correlation analysis, has become an invaluable analytical tool for spectroscopic characterization in various fields of application, including protein science, pharmacy, biomedical applications, and polymer or nanomaterial research. The technique of 2D-COS analysis was originally developed to study dynamic processes in which a spectroscopic probe is used to monitor the effect of an external perturbation on a given system. The system responds to the perturbation with characteristic changes that are monitored spectroscopically, e.g. by continuous acquisition of a spectral time series. The main purpose of 2D-COS investigations is to explore correlations that may exist between perturbation-induced spectral responses. In some situations, the 2D-COS analysis technique is useful not only to detect and visualize such correlations, but also to decipher the sequence of these spectral changes. Sources of perturbation may include changes in temperature, pH, pressure, concentration, or spatial coordinates when examining spatially heterogeneous samples. The 2D correlation concept has proven to be extremely useful in a wide variety of molecular spectroscopy applications based on IR, NIR, Raman, NMR, fluorescence and UV-visible spectroscopy.
An introduction into the history, mathematics and basic principles of 2D-COS can be found here: https://en.wikipedia.org/wiki/Two-dimensional_correlation_analysis
Getting Started
- Specification of computer configuration
- Screenshot of the mat2dcorr gui
- Downloading mat2dcorr - How to obtain the mat2dcorr toolbox?
- Installation of the mat2dcorr toolbox
- Disclaimer and license conditions
- Acknowledgement, relevant publications
- Frequently asked questions (FAQ)
Data Import & File Formats
- Import data in the CytoSpec imaging format (CytoSpec/Matlab)
- Import data in the trace format (Matlab)
- Import data in the MS Excel data format
- Format of a 2D-COS result file (Matlab)
Options of the mat2dcorr Toolbox
Related Publications and Web Links
- Two-dimensional correlation analysis (Wikipedia)
- I. Noda. Two-Dimensional Infrared (2D IR) Spectroscopy: Theory and Applications, 1990 Appl. Spectrosc. 44(4): 550-561
- I. Noda. Generalized Two- Dimensional Correlation Method Applicable to Infrared, Raman, and other Types of Spectroscopy, 1993 Appl. Spectrosc. 47(9): 1329-1336
- I. Noda. Determination of Two-Dimensional Correlation Spectra Using the Hilbert Transform, 2000 Appl. Spectrosc. 54(7): 994-999
- P. Lasch & I. Noda. Two-Dimensional Correlation Spectroscopy for Multimodal Analysis of FT-IR, Raman, and MALDI-TOF MS Hyperspectral Images with Hamster Brain Tissue. 2017 Anal. Chem., 89, 9, 5008–5016
- P. Lasch & I. Noda. Two-Dimensional Correlation Spectroscopy (2D-COS) for Analysis of Spatially Resolved Vibrational Spectra. 2019 Appl. Spectrosc. 73(4): 359-379
Oct 02, 2023: more details of the mat2dcorr Matlab toolbox will follow soon

