Options of the 2D-COS Main Figure
Jump to navigation
Jump to search
Menu bar options
File
- save 2D spectrum - stores the 2D spectrum and corresponding metadata, for details see section Format of a 2D-COS result file (Matlab)
- clear - data are deleted from memory and figures are set back to their initial state
- quit - exit the program
Load data
- Matlab imaging format: see Import data in the imaging format (Matlab)
- Matlab trace format: see Import data in the trace format (Matlab)
- Excel data format: see Import data in the MS Excel data format
Action
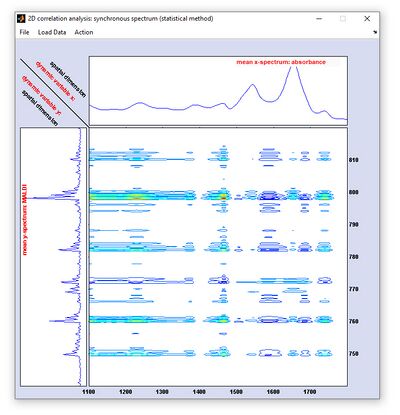
- plot 2D spectrum: computes the 2D correlation spectrum using the actual settings of the 2D-COS control window
- extrema of 2D fcn (function): obtains the minimum and maximum intensities of the current 2D correlation spectrum
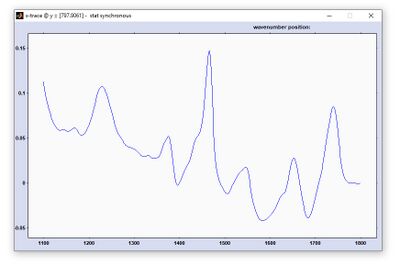
- plot x-slice: plots a 1D correlation (x) slices at a fixed y-position using the setting from the edit field [x,y] slice coordinates (y) of the 2D-COS control window, see screenshot below
- plot y-slice: plots a 1D correlation (y) slices at a fixed x-position using the setting from the edit field [x,y] slice coordinates (x) of the 2D-COS control window, see screenshot below
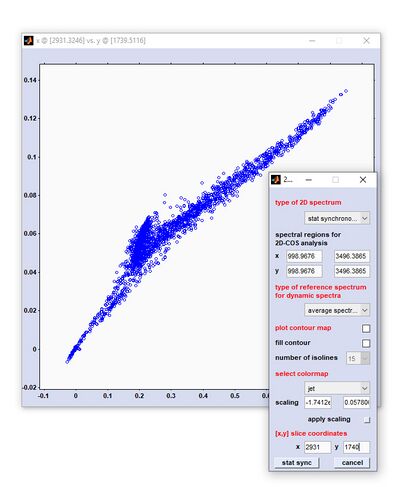
- plot [x,y] spectral features: creates an [x,y] feature plot using the settings from the edit fields [x,y] slice coordinates of the 2D-COS control window, see screenshot below
- invert colormap: inverts the colormap
- capture to bitmap: the current color representation of the 2D correlation spectrum is stored in a standard bitmap format
- display 2D-COS intensity (on/off): chose on to enables the MouseOver functionality; the option is helpful to obtain the intensity of the 2D correlation spectrum at defined [x,y] positions
Context Menu
- plot x-slice: plots a 1D correlation (x) slices at a fixed y-position using the setting from the edit field [x,y] slice coordinates (y) of the 2D-COS control window, see screenshot below
- plot y-slice: plots a 1D correlation (y) slices at a fixed x-position using the setting from the edit field [x,y] slice coordinates (x) of the 2D-COS control window, see screenshot below
- plot [x,y] spectral features: creates an [x,y] feature plot using the settings from the edit fields [x,y] slice coordinates of the 2D-COS control window, see screenshot below


